We collect so much data it’s hard to know what to do with it all. Where do you even start? It can be overwhelming. This is a common feeling once an implementation is in place (or when someone joins a team that actually has data). But this is where the fun begins!
Once you have data, you can begin to understand what is happening on your site and make adjustments in order to optimize your users' experiences and encourage conversions.
The workflow outlined here will help you tackle your abundance of data...one step at a time!
Focus on a single business question.
The best piece of advice I can give you is to focus. Choose one KPI or business question to answer. This is where you’ll begin your analysis. It’s important to choose something that matters, not just something you’re curious about. You’ll want the results of your analysis to clearly dictate your next plan of action.
Let’s say your team launched a new landing page last week and you want to know how it’s performing once users arrive. The goal of this page is to make your site visitors aware of a new product, and to secure preorders. The featured product is a stylish high performance shoe that dries quickly so it can be used for trail running, in-water adventures, and walking around town. You had set targets and implemented analytics to measure campaigns, traffic, interactions with modals, email signups, and preorder conversions.
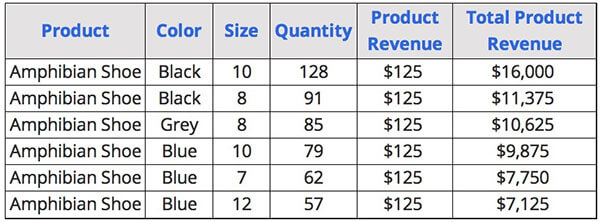
The question you want to start with is: “How many preorders did we get, and for which colors and sizes?”
In Google Analytics, you’ll want to pull reports that show number of preorders that successfully went through, along with the other metrics and dimensions you want to take a closer look at to inform your future decisions.
Here’s a sample of the data you might pull for an initial review of which color of shoe generated the most revenue in preorders:
Make a plan.
So, now what? It’s great if you have an initial plan in mind as you evaluate which KPI to begin digging into. But, once you have the data, reevaluate and flesh out your plan. How will you use this information to inform your business decisions moving forward?
Since you are taking preorders, perhaps this report’s information will help you determine how many of each color, or size, to stock from your distributor. Or maybe you’ll use it to help manufacturing develop a production plan for holiday season shopping. With a preorder, you may plan to watch the data for three more weeks to see how it changes. Or, you’ll plan a remarketing push with the most popular color shown in your email campaigns.
Based on your findings, create a plan (whether simple or complex) to help you move forward.
Take action.
This is the part where you do the thing you planned to do. Create the remarketing campaign! Send the emails! Work with your distribution team!
Sometimes, however, your plan will be to take no action - and that’s okay - but make sure this isn’t your default. Data should enrich your knowledge of your customer. And it should inform your business’ decisions - from improving your website and campaigns and elevating your users’ experience, to modifying your merchandising and shipping methods.
Do it again.
Once you address one business question, move down your list to the next. If you are making changes and updates to your site, keep in mind that even small, incremental changes can have domino effects. It will be important for you to continue evaluating the “consequences” - good or bad - of your actions. It’s important to pay attention to other dimensions and metrics surrounding the specific ones you’re reviewing. For example, maybe more blue shoes got added to carts, but there was a higher abandonment rate resulting in lower conversions overall. The key here is to never stop asking questions.
While it may be the simple answer, the solution to having “too much data” isn’t to ignore it! The solution is to use it! Dig in, piece by piece, and ask questions of your data to better your understanding of what’s working and what isn’t. When you come up with answers...develop a plan. Execute. Repeat.