Don’t get into a rut with your email marketing. If you’re not actively, and regularly, segmenting your audience and sending targeted emails to increase engagement and conversions, you’re missing out on potential revenue.
You’ve been told time and time again that segmentation can (and will) increase your results. In fact, a MailChimp report showed that segmented campaigns outperformed non-segmented campaigns to the tune of 14.31% more opens, 100.95% more clicks, and a 9.37% lower unsubscribe rate.*
But, how are you analyzing and learning from your past email performance and modifying your audience, messaging, and strategy as a result?
Digging Into Your Campaign Metrics
While almost every email platform will share the basic metrics associated with your individual campaigns, grazing over your click-through, open, conversion, and bounce rates is only part of the story. And, while there are certainly key learnings in these numbers, you’re only scratching the surface and seeing half of the puzzle. Dig deeper into the performance of your campaigns by leveraging the abundance of Google Analytics data at your fingertips. For it’s only when you analyze the two in tandem that you really get the full benefit.
The first step is ensuring that you’re using UTM codes on all your email marketing links to differentiate each campaign in Google Analytics. Luckily, most major email platforms have direct integration with Google Analytics for automated UTM link generation.
Now, let’s get into some campaign analysis. Though you can use similar steps to drill down on a variety of different metrics, we’ll use audience location (Geo Location) as a filter in this example. By adding in a secondary Source/Medium dimension with a filter of “email” to your default Location report, you can start to see which cities are converting at the highest rate as a result of email marketing.
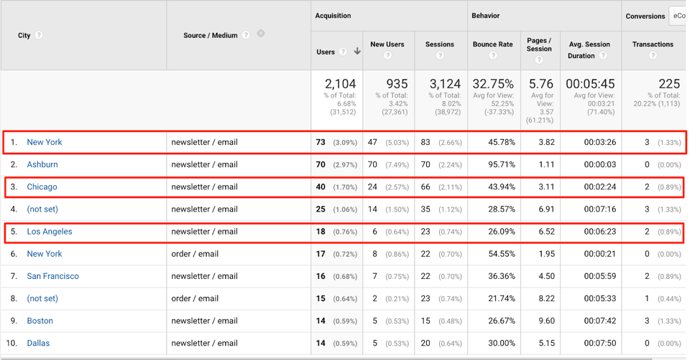
In the above example, you can see that New York, Chicago, and Los Angeles are three of your top transacting cities as a result of email campaigns.
What Actually Worked?
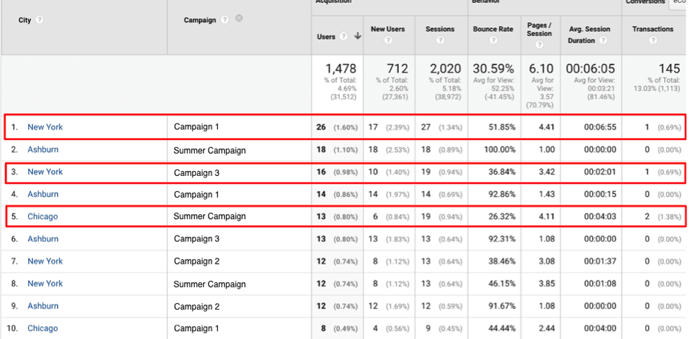
Taking it a step further and using Campaign as your secondary filter allows you to see which messages resonated the most with these particular converting audiences. For New York, Campaign 1 and Campaign 3 resulted in transactions, whereas in Chicago the Summer Campaign was most successful. Both cities, however, had campaigns that did not convert.
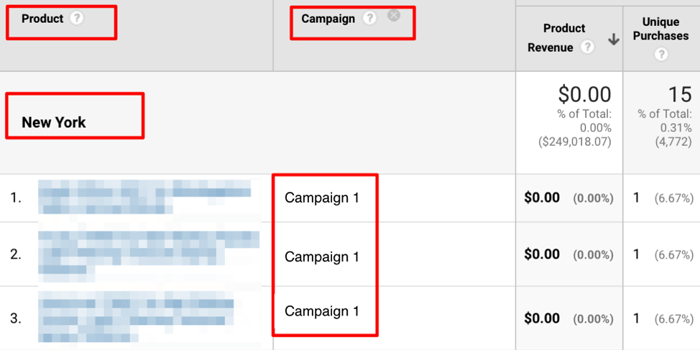
Using the Product Performance report with a secondary dimension of Campaign, and developing a segment that only looks at New York, would then allow you to see which specific products were purchased as a result of the email.
Using Past Performance to Modify Future Strategy
The key to unlocking this value behind these metrics is not stopping after the numbers have been analyzed. It’s taking the analysis and turning it into an actionable strategy for the future.
Though non-converting campaigns aren’t so fun to see in your reporting, they present opportunities for fine-tuning in the future. Did your campaign feature the wrong product? Was the messaging appropriate to this particular audience? Was the campaign sent at a bad time of day or day of week? Using both your email platform metrics and Google Analytics, you can start to narrow in on the “why” of these results and adjust the next campaigns.
Analyzing your higher-performing campaigns, and what helped make them successful, allows you to leverage these learnings for future revenue gains. How do you maximize a particular product in a location that’s responding positively? Are you utilizing messaging that worked well in these campaigns and mimicking it in other mediums, or deploying similar copywriting strategies for future sends?
Asking these key questions to better understand your audience, and then modifying your future campaigns and messaging strategy to align with the results will amplify your conversion rates bringing in more revenue per send. With this additional analysis and action, you can soon elevate email marketing to be a more profitable form of marketing for your business.
Is There a Simpler Way?
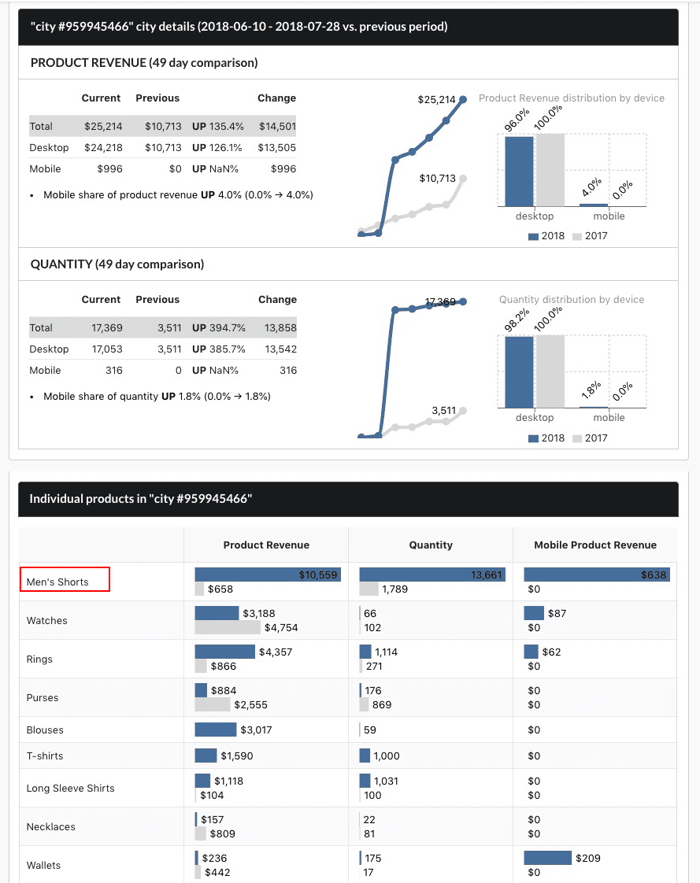
Though it’s absolutely possible to go through processes like the above after each campaign to generate opportunities and issues, there are now technologies that help to speed up the process. Arm your marketing team and data analysts with a tool that empowers them to move quickly and act on key insights from analytics, including total revenue based on city and products that are performing the best through your email channel.
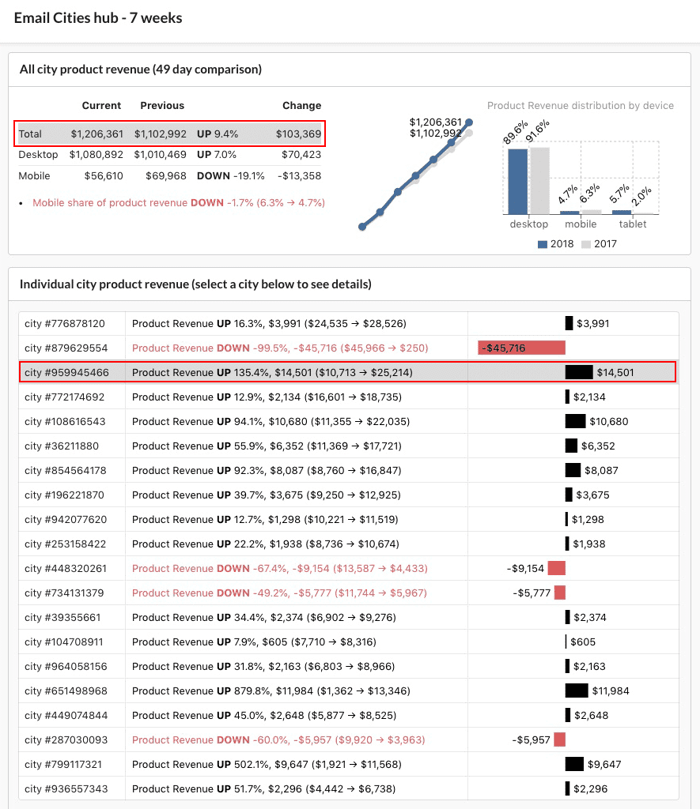
Not only can you see how individual cities are performing for email, you can click to "zoom in" and see how individual products are converting. It's never been simpler to have a clear view of what's happening in your business.